Walls and Bridges, Part 2: How Our Past Choices and Current Biases Continue to Shape Our World
What you leave behind is not what is engraved in stone monuments, but what is woven into the lives of others.— Pericles of Athens
In part 1 of this series, we explored the nature of implicit bias and its grounding in human neuroscience. We know that implicit biases are activated involuntarily, without our conscious awareness and outside of our control. We have a better understanding of how our mind controls the information it receives and how both our unconscious and conscious thinking patterns shape our responses to other people and to the world.
Part 1 focused on our thought patterns and on how our implicit biases drive our individual decision making. These decisions have a large impact on other individuals, simply due to whether or not we perceive them as part of the “in-group” or the “out-group” – whether they are “deserving” or “dangerous.”
But, what does this mean in the larger context? How does past action reverberate in our current land use and occupancy patterns? And does implicit bias perpetuate these patterns and, in some cases, even amplify them? This issue is at the root of our social and institutional disparity. Our history and our biases are made manifest in our patterns of living, our program designs, in our current deepened segregation and even in our fractured political reality.
In this article, we will begin to take a look at the research done into underlying community patterns and the implications for us as housing and community development professionals – not only in our current work, but in how we collectively understand what got us to this point and what we can now do to reshape our future in more inclusive ways.
Many of us have the luxury of thinking that, when it comes to where we choose to live and what we choose to pay, that we are making rational decisions based on quantifiable elements such as our ability to pay, or perhaps amenities such as the number of bedrooms, bathrooms, crime reports and school district data. We also tend to hold the thought that everyone has this same opportunity, maybe excepting only price point and creditworthiness. Many of us think that the lease or loan terms, the inspections and appraisals, approvals or loan processes are the same for everyone. Many of us would be wrong.
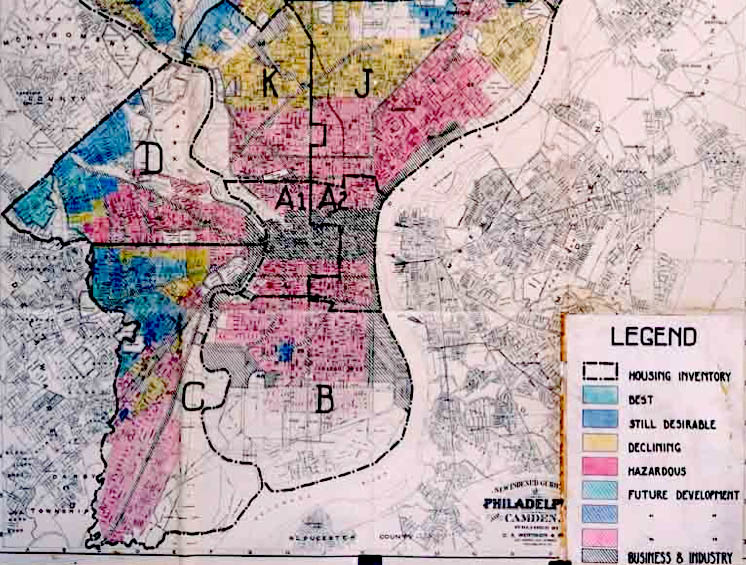
In its 2016 report, Challenging Race as Risk, the Kirwin Institute for the Study of Race and Ethnicity shows that there is a “clear record of the impact of structural racism on opportunities in home buying and credit access” that continues to this day. American history and its social patterns have created inherent structural disadvantages that continue to echo through today’s housing and wealth-building patterns. These include the outlawed practices of racial zoning, restrictive covenants and financial institution redlining that began at the dawn of the 20th century and continued through the 1960’s.
From an implicit bias perspective, the by-product of these practices has been to create an invisible pattern that advantages one group over another. This structural discrimination in housing, credit and economic opportunity originally led to people of color being over-represented in poorer communities. In time, people began to associate people of color with those poorer communities. As more time passed, this caused many Americans to associate poverty and neighborhood disinvestment with the actual victims of these policies. Through repeated exposure in the media and in other ways, these associations created a pervasive implicit connection of race to group risk: whether dangerous, poor and criminal, or deserving, safe and secure.
This, then, becomes a self-perpetuating system enforced unconsciously by our collective selves – homebuyers, sellers, lenders, appraisers, real estate and leasing agents, and government entities – all unconsciously maintaining the status quo.
These twin actions of long-term structural community patterns, coupled with implicit bias, create invisible barriers that eliminate opportunities for “in-group” people to challenge their own biases regarding others and make it difficult for “out-group” individuals to overcome those challenges. Ultimately, it limits regional growth and eliminates opportunities to close an ever-increasing wealth gap. It also creates the conditions and the playing field for displacement through gentrification by giving us an unconscious and false narrative of deserving “in-group” people willing to invest in a community and displace poor and criminal “out-group” people in order to improve it.
To give you an idea of just how daunting these barriers can be, in a 2011 study, Do Landlords Discriminate in the Rental Housing Market? Evidence from an Internet Field Experiment in U.S. Cities, Andrew Hanson and Zachary Hawley of Texas Christian University looked at disparities in the rental process. In the study, they contacted landlords across the country through a series of emails inquiring about rental units. Emails were signed with an “African-American sounding name” or with a “White sounding name”. They were also varied by some emails having better grammar and spelling along with formal greetings and closings, while others did not, in order to simulate higher and lower economic status. Emails were otherwise similar. The study’s findings showed that, on average, landlords responded to “white-sounding” names 6.3% more frequently than to the “African-American sounding names”. Bias was found to be more pronounced if both applicants appeared to be of lower economic status, at the rate of responding to “white-sounding names 17.5% more often. According to the study authors, the disparity appeared to be due to implicit bias and not to overt racism.
In another study, Discrimination in Mortgage Lending (Hanson, Hawley, Martin and Liu), the authors conducted an analysis of racial bias in email responses from mortgage loan originators, using the same methodology of names but including a low credit score, high credit score or no credit score. Researchers were able to demonstrate that inquiries with “African-American sounding names” would need to have a credit score 71 points higher than someone with a “white-sounding name” in order to receive the same response rate as “white-sounding name” applicants with an identical situation. Lenders responded to “white-sounding names” with a credit score of 700 at the same rate as to “African-American sounding names” with a credit score of 771.
What’s Past Is Prologue
Improved mapping and data analysis have recently given us a new window into community conditions. As a result, we have begun to de-bias and to see the need to change America’s racialized housing and program patterns.
Ironically, in post-civil rights America, segregation has grown worse in many communities, not better. Why would this be? While both structural (land use) and implicit bias (both systemic and personal) are implicated, long term settlement patterns are also to blame, along with a long history of federal, state and local policies that maintain or amplify the issue.
Richard Rothstein’s new book, The Color of Law (2017), looks at housing policies that mandated segregation. Mr. Rothstein maintains that the federal government’s housing efforts in the 1930’s – 1950’s were “primarily designed to provide housing to white, middle-class, lower middle-class families,” with the end result that people of color were left out of new suburban communities. Rothstein demonstrates that the Federal Housing Administration (FHA), established in 1934, furthered segregation by refusing to insure mortgages in and near African-American neighborhoods, creating the already aforementioned redlining. In the post-war years, the FHA was subsidizing builders who were mass-producing suburban subdivisions with the requirement that none of the homes be sold to African-Americans. This policy can be seen in the FHA’s “Underwriting Manual,” which said that “incompatible racial groups should not be permitted to live in the same communities.”
One can also see how government-mandated segregation played out in public housing developments such as Pruitt-Igoe in post-war St. Louis (Katharine Bristol’s The Pruitt-Igoe Mythis recommended viewing) and later in HUD’s Urban Renewal programs in the 1960’s. Public housing began during the New Deal to address a housing shortage caused by the Great Depression and the lack of housing construction. Middle- and working-class families were losing their homes when they became unemployed. In many states, some developments were segregated, with a section for whites and another section for non-whites. At the end of World War II, a confluence of circumstances resulted in jobs beginning to leave cities. Then white families left the cities to move into FHA’s new subdivisions, leaving behind remaining community members who no longer had access to good wages. For Pruitt-Igoe, where the City had expected a large influx of returning service members and their families to come work in manufacturing that never transpired, the “white” section had large numbers of vacancies, while wages and employment fell for residents. This, along with other policies, meant that operational stability could not be achieved and ultimately led to the development’s demise. Later, both Urban Renewal and the Interstate Highway System, in many cases, cut off disadvantaged communities from the rest of a city, causing community disruption that continues to the present day.
But, while this explains traditional landscape patterns of disparity that first became mental associations and then implicit biases, resulting in our national misconceptions about people of color in our collective mind, it does not fully explain why patterns of segregation have continued to worsen in many communities. For that, we will have to look at federal policy around housing vouchers, state and local land use policies and how implicit bias affect land use decisions.
Created in the 1970s, the Housing Voucher program (then known as the Housing Certificate program) was originally created as a way to increase choice for low-income households. It was conceived as an alternative to public housing and touted as a cost-effective private market solution. From the beginning, federal rent limits, known as Fair Market Rents, did not meet actual market availability. HUD first attempted to address this with housing vouchers (more cost effective! more consumer choice!), but this did not improve the situation. Over time, that disparity has worsened. Currently, Fair Market Rents are set at the 40th percentile of gross rents for typical non-subsidized rental units, which means that 60 percent of rents in a community are out of reach of the average voucher holder before s/he even looks for a unit.
In addition, in the Department of Housing and Urban Development’s Public Housing Operating Cost Study 2003, the study noted that homes entering the voucher marketplace were older, fully depreciated, properties. In practical terms, this has meant that voucher holders are confined to the cheapest and oldest units in the marketplace, with the end result that poverty and segregation have actually been exacerbated through market mechanisms. The stated reasons for choosing the 40th percentile may include the need to ensure that the program is not unduly costly to the government, but the decision-making choices include implicit biases about who constitute the end users of vouchers and value judgements about who is deserving and how much is deserved. The result, as demonstrated by the study, How Government Housing Perpetuates Racial Segregation: Lessons from Post-Katrina New Orleans, by Stacy E. Seicshnaydre, is that metro New Orleans had “twice the percentage of voucher families living in neighborhoods with poverty concentrations above 30 percent (46.9 percent), compared with voucher families in the top fifty metropolitan statistical areas (MSAs) (22 percent).”
A 2016 study by Michael Lens and Paavo Monkkenon, Do Strict Land Use Regulations Make Metropolitan Areas more Segregated by Income, demonstrates how restrictive land use regulations shape segregation across entire metropolitan areas. The study uses the Wharton Residential Land Use Regulation Index, which is based on 11 categories of use regulation. To look at economic segregation, the study uses measures developed by sociologists Sean Reardon of Stanford, David O’Sullivan of Berkeley and Kendra Bischoff of Cornell. The study’s four findings were:
- That density restrictions isolate the wealthy by increasing the concentration of affluence.
- That economic segregation is significantly higher in places where cities have stricter land use and density restrictions. Density controls in the cities lead to higher housing prices, but also to greater economic segregation across entire metro areas. According to the study authors, “density restrictions are a culprit in the social fragmentation of metropolitan areas…”
- That local government restrictions contribute to segregation. The authors discovered that segregation is “not associated with a broad measure of land use restriction overall, but is, instead, the result of more specific types of regulations.” As the authors state, “some land use restrictions (like zoning approvals) are much bigger culprits than others (like open space requirements).
- That state involvement can temper segregation. According to the study, segregation is lower in cities and metros where state governments are more involved in land use regulation, residential development and growth management.
For those of us interested in implicit bias, the study findings highlight what we already know: that isolation and lack of positive interactions and modelling means that implicit bias goes unrecognized and unchallenged, and this, in turn, leads to the creation of self-perpetuating systems of bias, reinforced through lending, program operation and land use choices.
You Cannot Build a House for Last Year’s Summer
Our current system took decades and the investment of quite literally billions of dollars in federal and sometimes state and local funds to achieve. It will take a large-scale effort and a large-scale investment of time, education and funding to dismantle.
As we move away from the past and work towards a more equitable system for all Americans, it is tempting to think that apparently neutral tools, such as mapping, will automatically promote the common good. And, in fact, we are beginning to see this hope made manifest in items such as HUD’s Small Area Fair Market Rents (SAFMR) and in the Affirmatively Furthering Fair Housing and Mapping tool. While mapping and index tools have given us great insight into the segregation of communities and a view into the outcomes of implicitly biased policies, there is a lot more work to do before such tools can be effectively deployed.
Aside from the lack of attention these tools bring to the built-in unconscious bias in ourselves and in our existing systems, none of these federal tools being presented come with incentives or funding to undo what was originally required and paid for. Instead, cities and housing authorities are being asked to independently dismantle a huge system created, funded and propagated by large scale outside investment without any funding other than planning tools during a climate where housing and community development funds are constantly in danger of deep cuts or outright elimination.
We must continually come back to the basic issue, as presented in the State of the Science: Implicit Bias Review 2013, implicit bias is “the attitudes or stereotypes that affect our understanding, actions, and decisions in an unconscious manner.” Remember that implicit bias is just that, implicit and unconscious. Unless we actually work on the underlying root cause, new systems will continue with old plagues, as we have already seen in the legacy of the Housing Voucher program and in the issues that surrounded Urban Renewal policies as well as in continued gentrification and displacement occurring around the country.
The use of new tools will not automatically help communities shed implicit bias or make a more level playing field. Indeed, an analysis of HUD’s SAFMR in HUD’s Interim Report of the Small Area Fair Market Rent (SAFMR) Demonstration shows that between 2010 and 2015, in a program designed to improve outcomes for voucher holders, the average payment standard for voucher holders decreased by 11 percent for SAFMR PHAs, while decreasing only 2 percent for non SAFMR PHAs. Tenant contributions, on the other hand, increased 16 percent in SAFMR PHAs. The increases were especially high in low-rent zip codes (22 percent), which may “indicate that some voucher holders chose not to move as payment standards fell”. While the goal is ostensibly to improve choice and individual outcomes – the program design actually reduces investment in low-income communities, while also tending to raise costs for vulnerable families.
An analysis by Yolo County Housing of impacts of the SAFMR in Yolo County and its four cities shows that, out of 23 zip codes covered by the SAFMR, very few families would potentially be positively impacted in one zip code while 23 families would be negatively impacted in another, with no change taking place elsewhere. In addition, as the HUD Interim Study also points out, many higher cost zip codes also have low housing availability so that the net result is lost investment in lower income communities and the overall potential for decline of the voucher’s leasing utility. This is especially problematic when considered in the context that three out of four at-risk renters receive no subsidy assistance (CBPP). Nothing in this discussion should be construed as being against mobility or the individual’s desire for a better life. This is, however, about how our implicit biases regarding traditional communities, low income communities and communities of color automatically determine them to be of less value and, therefore, unworthy of investment or improvement except in cases of gentrification.
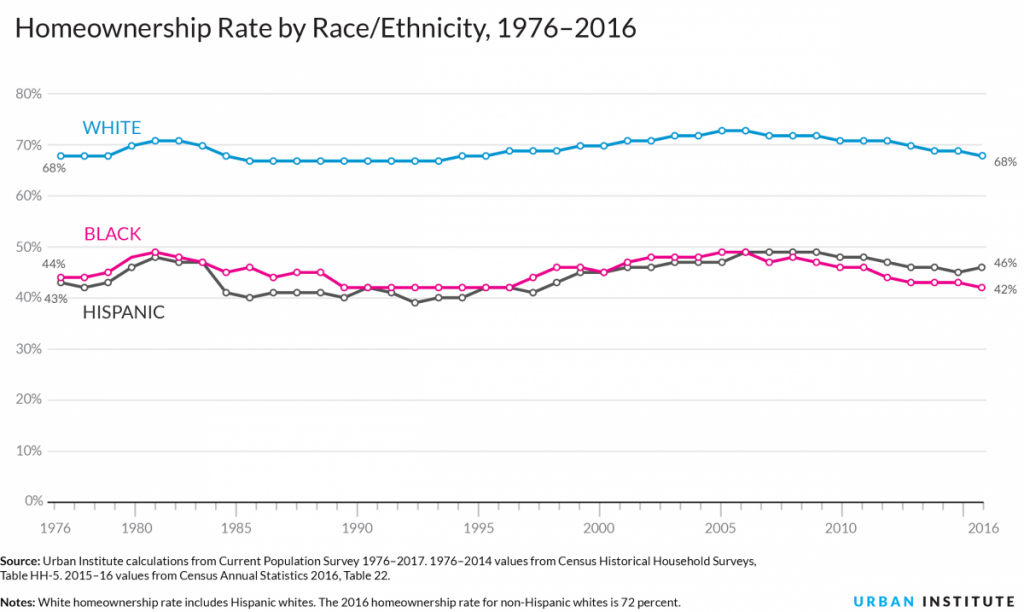
Bias isn’t always place-based. Despite the fact that for much of its history, America had a slight majority of households who were renters, we place a high value on homeownership. In fact, we impute more positive values to homeowners than to renters. We tend to believe implicitly that homeowners will automatically be better citizens, take better care of their homes and create secure neighborhoods, although there are quite a few code enforcement and residential rehabilitation programs to show that the process isn’t quite as automatic as we might think (c: The Social Benefits and Costs of Homeownership: A Critical Assessment of the Research Harvard Joint Center for Housing Studies).
It may be that this is the case in some, or even in many cases. But it isn’t always the case for every homeowner or for every community. It is a bias that we believe unconsciously and, because we as a society believe it, we reward homeowners disproportionately to renters through such things as the mortgage interest deduction at the federal level, in mortgage insurance products, in state tax structures.
The California Housing Partnership Corporation, in its March 2018 report, California’s Housing Emergency, found that the State of California’s expenditures per household are “highly inequitable” between homeowners and renters. It found that, through mechanisms such as real property tax deduction, mortgage interest deduction, renter’s credit, state housing funds (SB2) and state Low Income Housing Tax Credits, the State invests an estimated average of $929 a year per homeowner, but only $71 a year per renter. This inequity plays out in the geographic landscape as inefficient use of limited space for single family homes and higher energy and transportation costs to maintain them and tends to support the findings of the Lens and Monkkenon study cited earlier in this article regarding low density leading to metro fragmentation.
It’s also important to remember that these new tools born out of a desire to create equity are not working in a static environment or in a vacuum. They take place in our existing landscapes – including communities of real people and their long standing family ties and institutions. They have impacts on such disparate issues as traditional neighborhoods; the availability and use of important agricultural lands; on out migration from high cost areas to lower cost areas but commuting back for higher wages, while leaving the original population vulnerable to being priced out of their own communities. They affect water use, the watershed, employment, technology and manufacturing, as well as transportation, climate and jobs. In short, it’s complicated.
If we create new tools, but do not address our collective implicit bias, then many of our government, housing and credit institutions will likely continue to operate with objectivity, anchoring, conservatism and confirmation biases, believing that because decision making is based on mapping tools or on real data such as credit scores, zip codes and zoning allowances, that they are immune from implicit bias. And they will be wrong – implicit bias will continue to inhabit the system in the form of financing choices, density decisions, environmental policy, disconnection of jobs/housing balance, creditworthiness and community/individual risk profiles.
So, in that case, what can we do? There are steps we can take immediately and steps we can take over the longer term.
Faith Is Taking the First Step
As we outlined in the first article in this series, we need to start with baby steps and we need to start with ourselves. This includes:
- Basic training in implicit bias;
- Recognizing it in ourselves as individuals;
- Creating and maintaining a diverse workforce and educating our constituents; and
- Challenging stereotypes and fostering collegiality in workgroups.
In addition, we must have faith and be willing to take the next steps. We must:
- Maintain clarity of purpose;
- Create clear criteria for operations and success;
- Restate our equitable goals so that we can internalize them;
- Seek out ways to close opportunity gaps – in programs and in financing. This includes searching for viable alternative ways of determining true creditworthiness, working with families to be rent ready, working with landlords to overcome bias in leasing, and investing in financial wealth-building education for our constituents; and
- Demonstrate and ask for equity in housing and for the financial tools we need to change the systems and their geography.
And, we must build new partnerships with:
- Our legal services providers;
- Our banks;
- Our federal, state, and local governments; and
- Those who are isolated in their low-density neighborhoods.
And when we have accomplished these steps and met these new partners, we must search for the hard answers together – what do we stand for? How do we overcome institutional bias? How will we undo a century of funding into our now broken systems and who will help us find the funding to undo the damage? Because, ultimately, the question is: How do we, all of us, collectively work to create systems that will meet America’s call for freedom, equality, and opportunity for all of her people?
More Articles in this Issue
News Briefs
People FHLBank San Francisco Names Marietta Núñez Community Investment Officer On February 15, 2018, the…
Awards of Excellence: Speakers of the House
The King County Housing Authority (Wash.) won a 2017 Award of Excellence for its initiative to…Awards of Excellence: Referral Voucher Program
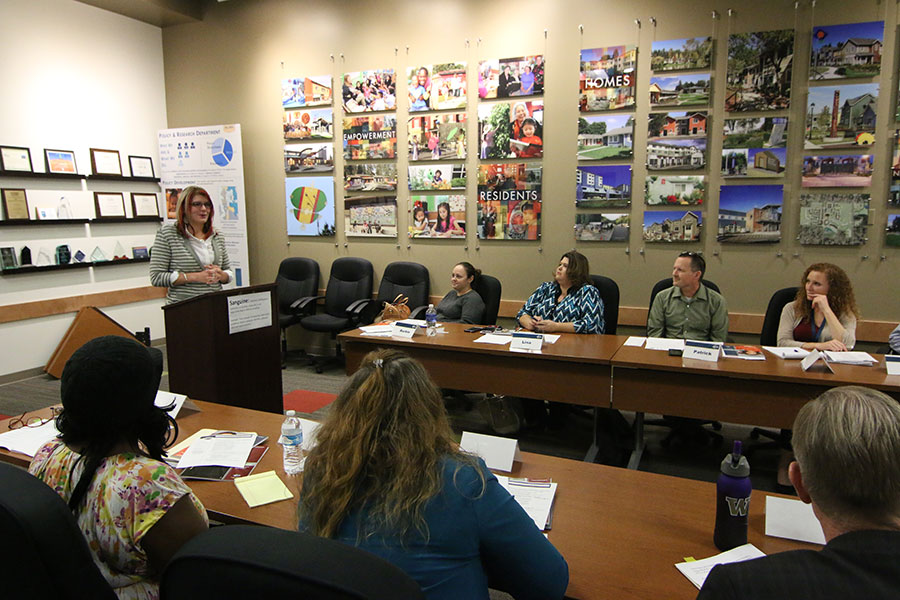
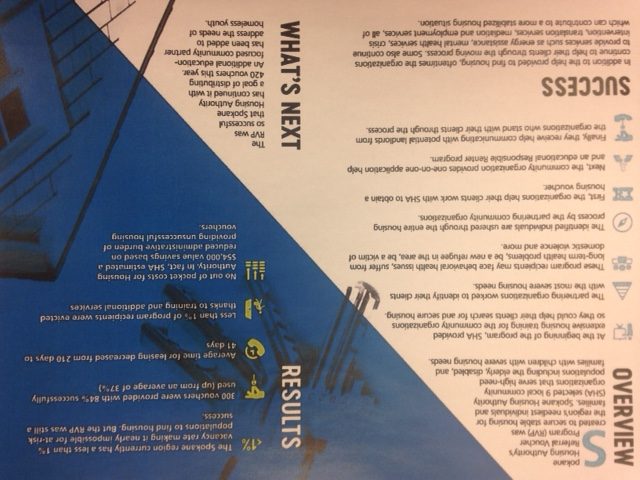
The Spokane Housing Authority (Wash.) designed a one-year pilot program to collaborate with local agencies…Transition Brings Opportunity: 2017 Regulatory Year in Review
Looking back at 2017, a theme became clear: transition. From a new President and HUD…Meet the 2017-2019 NAHRO Leadership
NAHRO President: Carl S. Richie, Jr., NCC, NAHRO-Fellow Chairman, Board of Commissioners Housing Authority of…Awards of Excellence: Homelessness – Let’s Talk About It!
The County of San Diego Housing and Community Development Services (Calif.) wins a 2017 Award…